Disclosure: Some posts contain affiliate links, which earn us a commission if you make a purchase through them. Positive Fishing © participates in various affiliate networks including the Amazon Services LLC Associates Program.
As anglers improve in their fly fishing skills, the smaller details of the sport become more and more important. When you’re no longer worrying about your casts, where to fish, and how to read water, you can start to explore the more technical parts of fly fishing skills.
Learning and understanding how to read hatch charts are what can separate a good angler from a great angler. You’ll gain vital information and give yourself an added advantage to land more fish and bigger specimens.
- In this article, I will cover:
- What is a Hatch Chart?
- How to Read a Hatch Chart
- Important Details to Know About Hatch Charts
- Hatch Charts Do Not Tell the Whole Story of the Insect
- Hatch Charts Do Not Provide All Information on the Entire Feeding Pattern
- Hatch Charts Do Not Account for Geography and Environment
- Where to Access Hatch Charts
What is a Hatch Chart?
A hatch chart is an easily readable graph that provides details on what insects are hatching in what bodies of water. Most hatch charts also clarify when these insects hatch and are in their adult stages.
With all of this information, anglers should be able to identify what flies to use and when to use them. As a result, anglers are likely going to land more fish due to being more informed about the conditions.
How to Read a Hatch Chart
When you get your first glimpse of a hatch chart, it’ll remind you of something you saw in high school math. Thankfully, it’s a much simpler graph to read than the one you would find in an Algebra class!
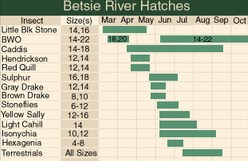
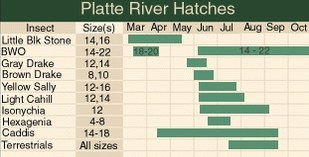
On most charts, there will be a long list of flies down the left side. Some patterns you’ll likely see are Caddis Flies, Stoneflies, Mayflies, and Midges. Depending on the depth of the chart, they may provide specific insects that are hatching. If it does, then you know you’re looking at a bit more detailed chart. Once you identify this list, you can look at how the chart has the months listed.
You’ll find these across the top of the chart going from left to right. Once you’ve identified these, you’ll see a big open space in the middle filled with darkened horizontal lines. These horizontal lines are identifying the flies that are hatching in specific months.
For example, on the Kinnikinic River in Wisconsin, Blue Winged Olive flies hatch from April to June. On the hatch chart for the Kinnikinic river, you’ll see these months filled in on the graph. This is showing that the adult stage of Blue Winged Olive flies occurs from April until June.
Tip: Almost all aquatic insects in the water are likely to be olive green, brown, gray, or cream in color. For each of these colors, ensure you carry at least one pattern. The best range of sizes should be a 10 to a 24. This will give you coverage for almost every insect hatch on any river or lake.
Important Details to Know About Hatch Charts
Hatch charts aren’t overly complicated to read, but the information they’re actually providing is a bit different than you would think. By understanding what you’re actually reading, you’ll have even more of a clear picture of what types of flies to use.

Hatch Charts Do Not Tell the Whole Story of the Insect
When you’re looking at a hatch chart, you’re only seeing the timeline on the adult stage of the insects. The adult stage is really only about 0.2 percent of an insect’s entire life cycle. Many insects that hatch in the water only have a couple of weeks of adult life cycle or even just a few hours. Therefore, the majority of their life is spent growing and developing in the water.
As a result, you shouldn’t only rely on your fly choice in the fact that a certain fly is only hatching through June and July. They’re still growing and developing underwater. You can easily fish the same flies, but they’d have to be a nymph or emerger pattern.
You can start fishing the nymph patterns a couple of months before the peak hatching months. They’re developing but aren’t quite able to reach the surface to hatch. The closer to the hatch you get, the larger nymphs you should use.
You can learn more about Nymph fishing for trout and bass here, or check out my in-depth article on Tips, gear, and flies when going Euro Nymph fishing.
Hatch Charts Do Not Provide Information on the Entire Feeding Pattern
Hatch charts also only highlight about 25 percent of a trout’s feeding focus. Yes, they feed on those insects, but they are also looking at other types of food that are available. Natural baits such as leeches, crayfish, and minnows are always on a trout’s menu.
The insect enforced on the hatch chart is likely the most plentiful and popular insect, but not the only food option. Don’t think that you have to live and die by a certain fly pattern!
Bring along your streamers and other searching patterns in case the suggested pattern isn’t quite working. This could very likely be the case, and you definitely want to be prepared to throw just about anything! There are always insects active in the water, so you may have to do some searching to find out which flies are also options that would work.
In Montana, for example, the Salmon Fly hatch is extremely popular. This happens every June and July. Most anglers are going to fish Montana waters due to the fun the Salmon Fly provides, but a closer look at the hatch chart for Montana would show a dozen other flies that hatch at the exact same time.
Hatch Charts Do Not Account for Geography and Environment
Many rivers that have hatch charts accessible are fairly popular. Plus, they’re usually fairly long. One hatch chart isn’t going to tell the whole story of a 200-mile long river. It’ll give anglers only a general idea of what is occurring, but it’s not capable of predicting water temperatures, the type of terrain, depth of water, and weather patterns. Therefore, it’s better to speak with a local fly shop or do your own reconnaissance work before you live and die by the hatch chart.
You hope that the hatch chart provides information about the active water temperature. The active water temperature is when the majority of hatches occur. If you’re fishing in the Rocky Mountains or Alpine lakes for trout, you’ll find rivers start up at 13,000 feet elevation, but fall to 7,000 or 8,000 feet. One hatch chart for this river isn’t going to say when the active water temperature happens at 12,000 feet and when it happens at 9,000 feet. It’s going to be based on one specific part of the river.

As you drop in elevation, the water temperatures are going to warm earlier in the year. Therefore, the peak fishing windows open and close faster than they would at other elevations. Make sure you take the elevation at which you’re fishing into consideration. It’ll help you plan your trip to get on the water at the exact right time.
If a hatch starts at the lower elevation, you can essentially follow it until it gets to its highest elevation. It’s a fluid pattern. As the season continues, the water temperature warms, and the hatches begin to occur. However, depending on runoff, air temperature, and several other factors, the hatches could be early or late. It’s important to get some local knowledge before you hit the water.
Where to Access Hatch Charts
While you can’t do a ton of online work to prepare for a day of fly fishing, hatch charts are one of those things that you can use to help you prepare. Studying one of these will help you get your fly box ready or know what to purchase when you visit a fly shop before your trip.
For the most part, you can google “Hatch Chart for ______ River.” This will likely take you to a fly shops website or a different platform that’s going to provide access to all sorts of different types of hatch charts.
You may have to visit a fly shop or local outdoor company to get a full idea of what flies are hatching or to see a physical hatch chart, but the majority are available to anglers online. As long as you know what to look for on a hatch chart and can identify the elevation you’re fishing, you’ll be good to go.
Once you’ve identified the insects that are going to adults, know that you should likely have some of those patterns available to fish. However, take a look at the other patterns that may be hatching a month or so later. Once you find these, it’s not a bad idea to grab some nymphs that represent these patterns. They’re being eaten, so you might as well throw them. Remember, the closer you get to the hatch, you should throw a more accurate representation of the fly.
Final Thoughts
By reviewing the specific hatch charts for where you plan to fish and understanding how to read between the lines, you will be far more ready on your visit to the water. This will take out some of the guesswork in your fly selection process and gain the confidence to certainly increase your catch rate and bigger fish!
There are thousands of different dry-fly patterns. To match the hatch requires only the basic colors to imitate any particular insect on the water.
I hope you enjoyed reading my article and now have a better understanding of the hatch charts. Why not check out my in-depth review of my personal picks for the best trout flies? or read my article on How to plan for the perfect fly fishing vacation here!
- Wading Belt Essentials: Ensuring Safer Fishing - January 9, 2024
- Fishing For Catfish (Top Tips, Bait, & Gear To Catch The Big 3) - October 20, 2022
- Fishing Line Strength Vs. Diameter Chart: Why Is It Important? - October 12, 2022